Where are frequency distribution table examples for grouped and ungrouped data used? Think about a situation where you get to visit the same place for a party every day. You complain to your friends about the same, but all in vain. Now, you decide to create a frequency distribution table for this data to show it to your friends as proof.
What you have actually done is you have represented the entire information in the form of a frequency distribution table, as this will not only help you organise the information in a much concise manner but also get a graphical representation of the data that will let your friends believe on your point. This is grouped data. We can also help you understand the ungrouped frequency distribution in the same way.
Owing to the significance of this integral part of statistics, we have recruited some of the best, world-class statistics assignment help experts in our panel who can look into all the queries that students send to us. My Assignment Services is the name that you can trust upon, just like a vast majority of students in the United States of America do. Let us get started with the blog and know more about Frequency Distribution Table Examples For Grouped & Ungrouped Data.
Different Types of Frequency Distribution Tables That Our Experts Have Covered So Far
Did you know that there are other frequency distribution tables other than grouped and ungrouped as well? Yes, there are three more kinds of frequency tables that our statistics assignment help writers have come to terms with.
When you will solve these assignments, the following is the frequency distribution tables that you would be required to make for different sets of data.
- Grouped frequency distribution
- Relative cumulative frequency distribution
- Ungrouped frequency distribution
- Cumulative frequency distribution
- Relative frequency distribution
Each of the above-mentioned types has a unique set of frequency distribution tables for them. However, among them, the most important ones are grouped and ungrouped frequency tables as we recurrently get questions on them from students all over the world. Owing to this, we will now proceed with giving you some Frequency Distribution Table Examples For Grouped & Ungrouped Data.
What Do You Mean by Grouped and Ungrouped Data?
In order to understand the examples that we will be discussing on these two sets of data, it is imperative for you to understand how to distinguish them. Putting it simply, any kind of raw data that has not been categorized under any fixed group or does not have any fixed characteristics, that data set is known as the ungrouped data. And, when this raw data is organised in a group according to some common features or characteristics, it becomes the grouped data. For example, if we say there are 50 adults and 30 children in the sample population, then this will be an example for grouped data. Now, we are in a position to proceed with Frequency Distribution Table Examples For Grouped & Ungrouped Data to give you a clear picture of what this actually means and how to create tables for them.
Frequency Distribution Table Example For Ungrouped Data (Raw Data)
After knowing more about ungrouped data, it will be easier for you to now understand the example that our statistics assignment help experts will put forth in this section for you.
For example- We have a data set of total marks (out of 10) that 10 students score in a mathematics test as follows.
2, 4, 5, 7, 7, 3, 2, 8, 10, 9
As you can clearly see, this is the data for ungrouped frequency distribution. Now, let us give you a frequency distribution table example for ungrouped data.
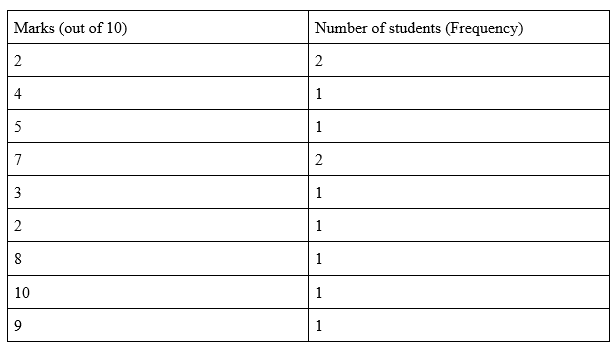
This is a frequency table that has been created by one of our statistics assignment help experts for students. Here, we have checked the individual marks of students and determined the total number of students (frequency) who got that particular mark. Now, let us move on to the frequency distribution table for grouped data.
Frequency Distribution Table Example For Grouped Data
Now, let us take an example of another data set to understand this better. Then, we can proceed with the frequency distribution table for the same.
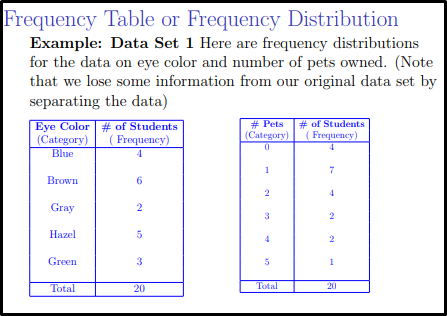
For example- We have a data set of 20 students and the total number of marks that they have got in a mathematics test (out of 100) as follows.
10, 10, 35, 56, 68, 88, 28, 67, 89, 74, 78, 25, 28, 57, 79, 89, 37, 45, 85, 46
Now, we can create class intervals in this data and group it under different categories of marks. Let us give you the frequency distribution table example for grouped data as follows.
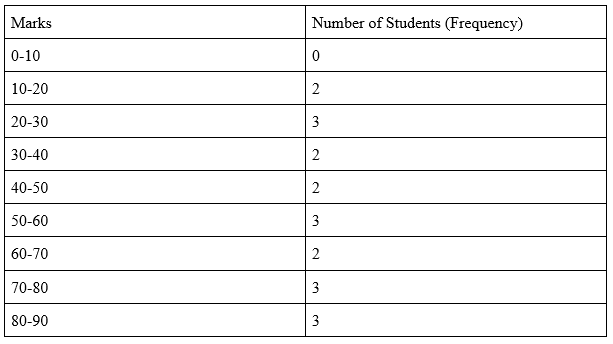
This is a frequency table that has been created by one of our statistics assignment help experts for students. However, this is more confusing for most of the students as there is a lower limit and upper limit here as well. As you can see in the above table, 10, 20, 30, and so on fall in two-class intervals.
Thus, it requires a lot of understanding in making these tables for a different set of data. With these Frequency Distribution Table Examples For Grouped & Ungrouped Data, we hope we could make things easier for you. If not, then you can always reach out to us via live one-on-one sessions whenever you need our guidance on any of these assignments.
“Can You Provide Me with Samples”? Yes, Of Course, We Can. Check Our Value-added Services
We have a vast repository of reliable samples for you. Referring to them will bring you a step closer to your dream grades, even in these technical statistics assignments. My Assignment Services is a boon for a million students in the USA and all across the globe for over a decade now. We have a unique range of perks waiting for you when you get in touch with us. These include:
- We have certified MAS experts in our team who supervise all the quality check processes and ensure to resolve each of the student queries within a few moments. We also carry out 21-step multiple quality check processes to ensure that we provide nothing less than the utmost quality work to our clients.
- Our client satisfaction manager supervises each of the quality check processes and reverts within a few moments to solve all the queries of students effectively.
Get in touch with us and fill up the order form now. Hurry up!

