Which are the variables that you, as an economic student, need to know for analysis? The basic emphasis of a cross-sectional data analysis is studying a particular variable. The study’s objective is to learn more about a particular variable and its relationship with other variables. Are you confused about what we just said? No worries, the study of quantitative or qualitative aspects of a population is not complicated. Once you understand what it all combines and why it does, you get a clear picture of the analysis. Well, keep reading further to take a closer look at the analysis of two different types of data.
There are two different types of data analysis when it comes to cross sections. One is time series analysis, and the other is cross-section panel data analysis. Both of these kinds of analyses of two different variables offer different advantages. Put a pin on learning about how to analyse data in the cross-sectional study. First, you need to understand the basic difference between a cross-sectional and a panel data study. Both forms of data are different and contain different methods to study and analyse. Hence, studies of both serve different purposes. When you know the basic information on both, you will be able to conduct a thorough analysis.
Purpose Of The Data Analysis
A cross sectional data analysis or the panel data analysis serves a similar purpose. Both of them provide a description of the target population. This description helps the researcher and you, as an economics student, to draw conclusions. The study of the target population and/or two different variables allows you to create hypotheses and identify patterns. The common purpose of any analysis is to provide key information and insights into the target population.
Two Different Types Of Study
One is cross-sectional, and the other is longitudinal, also called cross-section panel data. The study of the variables in a particular geographic area or any other domain is a part of the analysis. No matter which one you focus on, both provide the evaluation of the target population. This evaluation contains insights into a target population with a variable. In some cases, this evaluation contains two variables at once to determine the behaviour of the target population. Let us understand what these two different studies are and what purpose they both serve.
What Is Cross-Sectional Data?
Cross-sectional data is a type of data that reflects the relationship between different variables at the same time. An example of a variable is the unemployment rate, inflation, and consumer purchasing power. It can be noted for a particular time period but does not extend itself long like longitudinal data. The cross-sectional study contains a specific target population and economic units. These units are measure points of that target population. Examples of these economic units are age, gender, sex, educational level, financial status, etc.
What Is Panel Data?
Cross-section panel data is often referred to as longitudinal data and is similar to cross-section data. The study of panel data involves the analysis of different subjects in multiple time periods. A difference in panel data with cross-sectional is that it observes subjects over a longer period of time. The cross-sectional has either a fixed time frame or multiple time periods. However, in cross-sectional studies, the timeframe ranges over a relatively short period of time compared to cross-sectional studies. The purpose of the study in the panel is similar to that of the cross-section.
Difference In Conducting Analysis
We have gone into detail regarding the data analysis in both economic matters. If you still feel you need help to understand, take the econometrics assignment help. We will guide you in understanding the terminologies and processes from scratch. Our team of academic experts will provide you with the information you need to understand the concept better. The online resources and digital library come as a value-added benefit to your assistance. These will guide you further in developing a comprehensive understanding. Let’s move forward now.
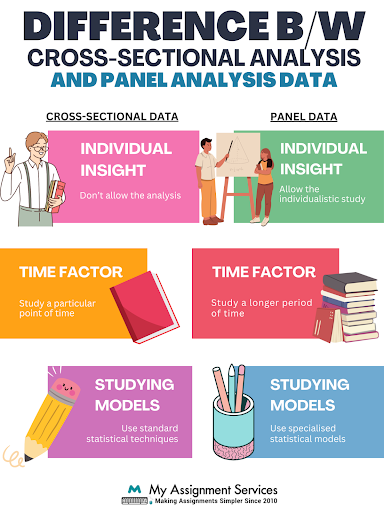
What is the difference between both forms of data when it comes to conducting an analysis? We shall lean into this part of information now. In a nutshell, we learned that cross sectional data and panel data have different metrics. But both of them share the same purpose in economics. But how do both differ in obtaining the final findings of the data analysis? Take a look at the table below to understand.
| Parameter | Cross-Sectional Data | Panel Data |
|
Individual Insight |
Don’t allow the analysis |
Allow the individualistic study |
|
Time Factor |
Study a particular point of time |
Study a longer period of time |
|
Studying Models |
Use standard statistical techniques |
Use specialised statistical models |
|
Variable Study |
Accounts for one variable |
Can account for multiple variables |
How To Conduct Data Analysis?
Now that you have understood the basic difference between data types, learn the methods for data analysis. The cross-section panel data differs mainly from the time range perspective with cross-section data. However, the analysis in both studies differs.
Cross-Section Analysis
The analysis of the cross-section requires the simplified steps mentioned below.
- Collect, clean and prepare the data. Check for errors and missing values to organise it.
- Evaluate the descriptive statistics with the measures of central tendency and dispersion.
- Create a visualisation of the variables and their distribution, indicating the pattern.
- Do hypothesis testing with t-tests, chi-square tests, and correlation analysis.
- Go with the appropriate regression analysis to interpret the variables’ relationship.
- Identify the relationship between variables and conduct subgroup analysis if necessary.
- Summarise the results of the analysis and present those findings clearly.
- Conduct a final analysis of the sensitivity of the key findings to assess the accuracy.
Panel Analysis
While being the same, these steps differ a bit. You will also find the details in our online statistics assignment help.
- Collect, clean and prepare the data. Check for errors and missing values. Look for the panel attritions and data consistency. Format it correctly with identifiers put correctly.
- Determine the descriptive statistics for each variable. Examine the characteristics. Identify trends and patterns within the data.
- Represent relationships between variables in different time periods with visualisation. Use line plots, time series and heatmaps.
- Choose the appropriate specialised panel data (statistical) model. Estimate the parameters for individual variables and time series.
- Form a hypothesis and use statistical tests such as t-test, f-test according to the different assumptions compared to cross sectional data.
- Examine changes in variables over time and identify factors that influence the changes. Use longitudinal techniques such as curve modelling and others.
- Look for patterns in the relationship between variables within subgroups. Do the subgroup analysis to identify subgroups.
- Interpret the findings of the analysis with respect to the hypothesis. Present the final findings clearly in a table or a figure.
How About You Give It A Try?
Now, you know the basics of the cross-sectional data and how to conduct the analysis. We explained to you how panel analysis differs from cross-sectional analysis. The data analysis of both types requires some basic steps, as we have mentioned. By following these steps, you can create a wonderful economics assignment. If you are still facing issues figuring out the right approach, we are here to help. We provide online assignment help to students who are looking for the right academic assistance. Register now to begin working on the assignment!

Related Study Materials
Our Experts can answer your Assignment questions instantly.
Ask QuestionAbout the Author

RELATED POSTS


0 Comment
Get It Done! Today
1,212,718Orders
4.9/5Rating
5,063Experts


Loved reading this Blog? Share your valuable thoughts in the comment section.
Add comment